Divorce Statistics 2025: Latest Data, Global Trends & Surprising Insights
Divorce rates have long been a social barometer — reflecting shifts in culture, economics, gender roles, and even mental health. As we move into 2025, global divorce statistics reveal fascinating patterns: while some regions see rates stabilizing, others are experiencing record highs.
Using data from leading organizations like the CDC, Pew Research Center, OECD, and United Nations, this report uncovers the latest insights into how marriages are changing — and what those numbers say about our societies today.
Global Overview: What the 2025 Divorce Landscape Looks Like
According to recent UN and OECD data, global divorce rates continue to vary widely by region. Western nations typically report higher rates, while many Asian, Middle Eastern, and African countries maintain lower ones — though those numbers are gradually rising.
Key Global Takeaways (2025):
-
The global divorce rate averages between 1.6 and 2.9 per 1,000 people.
-
Europe and North America remain the regions with the highest divorce rates.
-
Asia is witnessing a significant rise, particularly in urban centers like Seoul, Tokyo, and Shanghai.
-
Religious and cultural factors still play a major role in countries with lower divorce rates, such as India and the Philippines.
Table Placeholder:
Global Divorce Rates by Region (2025)
| Region | Estimated Divorce Rate (per 1,000) | Notable Trends |
|---|---|---|
| North America | 2.5 – 2.9 | Stable to slightly rising (CDC, 2024) |
| Europe | 1.9 – 2.6 | Gradual decline in Nordic countries |
| Asia | 1.3 – 2.0 | Sharp rise in East Asia |
| Latin America | 1.2 – 2.1 | Urban increase, rural decline |
| Africa | 0.8 – 1.5 | Underreported but slowly rising |
(Data compiled from OECD, UN Demographic Yearbook, and national reports)
The Rise of “Gray Divorce”
One of the most striking modern trends is the surge in divorces among couples over 50 — often called gray divorce.
According to Pew Research Center, the divorce rate for adults 50+ has doubled since the 1990s, while the rate for younger adults has plateaued or declined.
Why It’s Rising:
-
Increased financial independence among women.
-
Longer life expectancy — leading to more midlife reassessment.
-
Reduced social stigma toward divorce in later life.
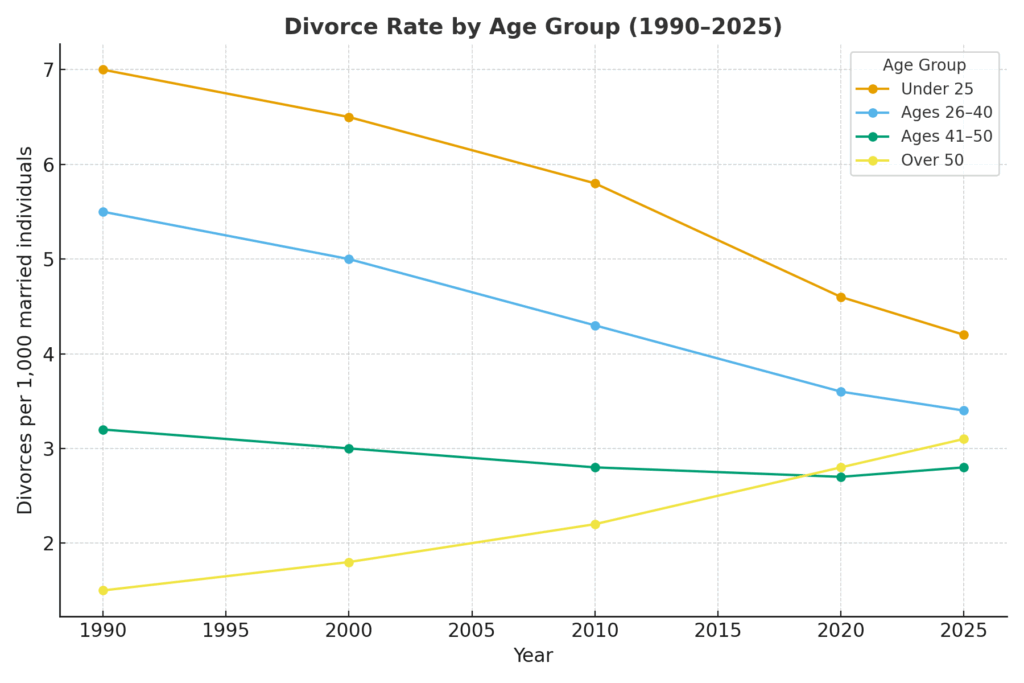
Chart: Divorce Rate by Age Group (1990–2025)
Divorce Rates by Country (2025 Snapshot)
Recent OECD and national statistics show that divorce rates fluctuate sharply depending on social norms, urbanization, and access to family courts.
Countries with the Highest Divorce Rates (2025 est.):
-
Maldives – ~5.5 divorces per 1,000 people
-
Russia – ~3.8
-
United States – ~2.6
-
Portugal – ~2.4
-
Denmark – ~2.3
Countries with the Lowest Divorce Rates:
-
India – ~1.0
-
Chile – ~1.2
-
Ireland – ~1.3
-
Mexico – ~1.4
-
Italy – ~1.5
These numbers, while approximate, highlight the impact of cultural expectations and legal processes. In nations where divorce remains legally or socially difficult, rates remain low even when marital dissatisfaction is high.
U.S. Divorce Statistics 2025: Key Facts
The Centers for Disease Control and Prevention (CDC) and the National Center for Health Statistics (NCHS) track annual U.S. marriage and divorce rates. While 2020–2021 saw a temporary dip during the pandemic, the divorce rate has since rebounded slightly.
U.S. Divorce Rate by Year (2000–2025)
| Year | Divorce Rate (per 1,000 population) | Notes |
|---|---|---|
| 2000 | 4.0 | High due to Baby Boomer divorces |
| 2010 | 3.6 | Steady decline begins |
| 2020 | 2.3 | Pandemic-related drop |
| 2023 | 2.5 | Mild rebound post-pandemic |
| 2025 | ~2.6 (projected) | Slight rise, stabilization expected |
(Source: CDC/NCHS, 2024)
Additional U.S. Insights:
-
The average marriage lasts around 19.8 years before divorce (U.S. Census, 2024).
-
The median age at divorce is 46 for men and 43 for women.
-
About one-third of divorces involve children under 18.
The Pandemic Effect and Post-2020 Rebound
The pandemic years were an anomaly. Lockdowns initially delayed many divorces, as court closures and economic strain kept couples together longer than expected. By 2023, however, filings surged as normal legal operations resumed.
Pew Research (2023) noted that Google searches for “divorce lawyer near me” rose 25% between late 2022 and early 2024 — a sign of pent-up demand.
However, experts caution that this may represent a temporary normalization, not a long-term reversal of the decades-long decline in divorce rates.
Marriage vs. Divorce: The Ratio in 2025
In 2025, for every 1,000 marriages, roughly 340 end in divorce, according to combined U.S. Census and CDC estimates.
This ratio is significantly lower than in the 1980s and early 1990s when divorce rates peaked.
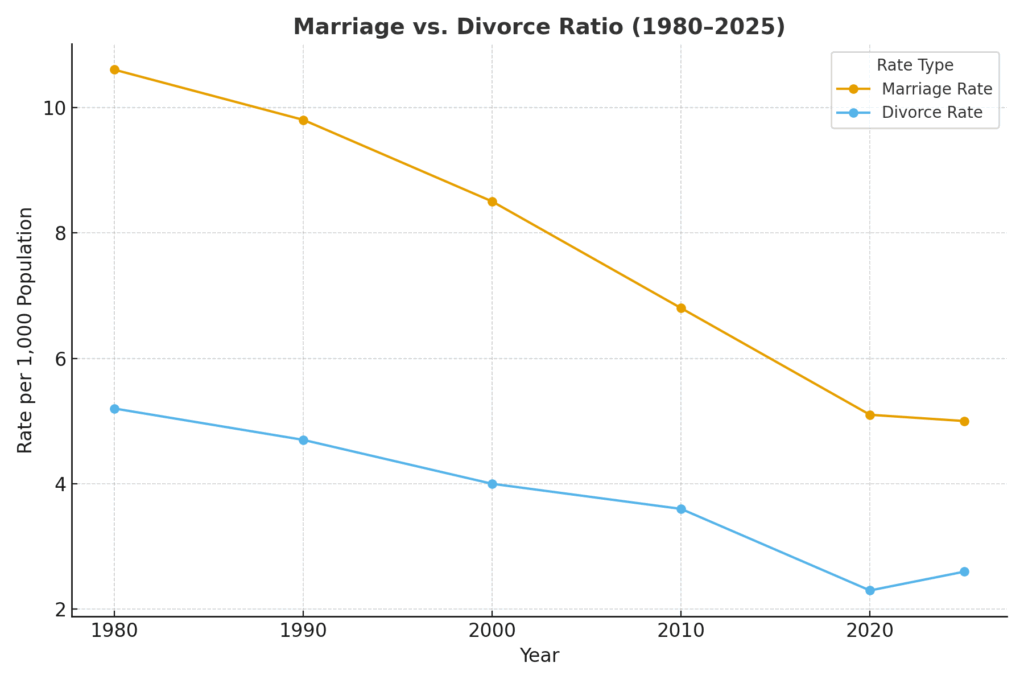
Chart: Marriage vs. Divorce Ratio (1980–2025)
Key Takeaway:
While the cultural narrative often paints marriage as “in decline,” the data suggests fewer people are marrying — but those who do tend to stay together longer.
Demographic Insights: Who Is Most Likely to Divorce in 2025?
Divorce is not evenly distributed across age groups, education levels, or regions. Data from the U.S. Census Bureau and Pew Research Center reveal that certain demographic and social factors consistently influence marital stability.
1. Age and Divorce Risk
The likelihood of divorce decreases with age — up to a point.
-
Early marriages (under 25) have the highest risk, with divorce rates nearly double those of couples who marry after age 30.
-
Couples who marry between ages 28–32 tend to have the lowest divorce probability.
-
Beyond age 50, the gray divorce trend (covered earlier) begins to rise again.
2. Education and Income
Education remains one of the strongest predictors of marital longevity.
-
Individuals with a college degree or higher are about 20–30% less likely to divorce than those with only a high school education (Pew Research, 2023).
-
Financial stability significantly reduces marital stress — particularly regarding debt, home ownership, and employment security.
3. Religion and Cultural Context
Religious participation continues to influence marital stability. Pew studies show that couples who attend religious services together at least twice a month are significantly less likely to divorce compared to those who rarely attend.
However, secular societies (such as in Northern Europe) still maintain relatively low divorce rates — suggesting social support systems and gender equality can offset religious differences.
4. Regional Patterns (U.S.)
Within the United States, divorce rates vary by state. According to CDC data (2024):
-
Highest divorce rates: Nevada, Arkansas, Oklahoma, and Alaska.
-
Lowest divorce rates: Massachusetts, Illinois, and New Jersey.
Divorce Rate by U.S. State (Top 5 vs Bottom 5, 2025)
| Rank | State | Divorce Rate (per 1,000) |
|---|---|---|
| 1 | Nevada | 3.8 |
| 2 | Arkansas | 3.5 |
| 3 | Oklahoma | 3.4 |
| 48 | Massachusetts | 1.2 |
| 49 | Illinois | 1.3 |
| 50 | New Jersey | 1.4 |
Key Causes of Divorce in 2025
Although the cultural context evolves, the reasons behind divorce remain remarkably consistent — with some new modern twists.
Top Reasons Cited (Pew & CDC Marriage Survey, 2024):
-
Infidelity (22%) – Still the most common cause.
-
Financial stress (19%) – Debt, job loss, and inflation-driven pressure.
-
Communication breakdown (18%) – Increasingly cited in the digital era.
-
Incompatibility or lack of shared goals (16%)
-
Substance abuse and mental health issues (10%)
-
Work-life imbalance (8%) – Especially among dual-career couples.
A new factor emerging in 2025 is “digital drift” — the erosion of intimacy caused by constant device use and online socialization, leading to emotional disconnection.
Economic and Social Impact of Rising Divorces
The economic effects of divorce ripple far beyond the couple involved. The OECD (2024) estimates that households led by a divorced parent have, on average, 35% lower wealth accumulation than married counterparts.
Broader Impacts Include:
-
Housing Market Shifts: Rising single-person households boost urban rental demand.
-
Workplace Productivity: Divorce-related stress costs U.S. employers an estimated $6 billion annually in lost productivity (Forbes, 2024).
-
Child Well-being: Studies show children of divorced parents face short-term emotional distress, but most adapt successfully when parental conflict remains low.
The Future of Marriage and Divorce (2025–2030 Outlook)
Experts predict that the coming decade will bring stabilization, not resurgence, in divorce rates.
-
Marriage rates will remain lower than pre-2000s, but those marrying later in life are more deliberate and financially secure.
-
Prenuptial agreements are rising — especially among Millennials and Gen Z.
-
AI-based relationship therapy tools and online counseling platforms are making marital support more accessible, potentially reducing future divorce filings.
Demographer projections suggest that by 2030, the U.S. divorce rate may hover around 2.4 per 1,000, slightly below the current 2025 estimate — indicating a slow but sustained decline.
Chart Placeholder:
Chart: Projected U.S. Divorce Rate 2025–2030 (CDC/NCHS Model)
Comparative Analysis: U.S. vs. Global Divorce Trends
While the U.S. rate appears to be stabilizing, many developed nations in Europe and East Asia are seeing gradual increases.
-
Japan and South Korea report record-high divorce filings as younger generations challenge traditional family roles.
-
Northern Europe (e.g., Sweden, Norway) shows steady declines due to cohabitation replacing formal marriage.
-
Middle Eastern and African nations remain low in divorce rates, though changing gender norms are gradually shifting the statistics upward.
Projected Divorce Rate Change by Region, 2025–2030
| Region | Trend | Primary Drivers |
|---|---|---|
| North America | Slight decline | Later marriage age |
| Western Europe | Stable/decline | Cohabitation norms |
| East Asia | Rising | Urbanization, gender equality |
| South America | Moderate rise | Legal reforms |
| Africa | Slow rise | Cultural shift, economic stress |
Frequently Asked Questions (FAQ)
Q1: What is the current divorce rate in the United States (2025)?
The U.S. divorce rate in 2025 is approximately 2.6 divorces per 1,000 people, based on CDC projections and state-level data.
Q2: Which country has the highest divorce rate in 2025?
The Maldives remains the world’s leader, with around 5.5 divorces per 1,000 population, followed by Russia and the U.S.
Q3: Is the global divorce rate increasing or decreasing?
Globally, it’s rising slightly — especially in Asia and parts of Latin America — but has stabilized in North America and Europe.
Q4: What age group is divorcing the most in 2025?
The highest rates are among adults aged 45–54, followed by younger marriages (under 25) with higher early failure risk.
Q5: How has technology affected divorce rates?
Technology is a double-edged sword — it enables relationship support apps and therapy but also increases emotional distance and infidelity opportunities through online interaction.
Conclusion
Divorce in 2025 paints a complex picture of progress and challenge.
The numbers suggest that while fewer people are marrying, those who do are more intentional — leading to fewer but stronger marriages. Yet, evolving gender roles, digital habits, and economic uncertainty continue to test relationships in new ways.
Understanding these divorce statistics is more than just reading numbers — it’s about recognizing how social change reshapes love, partnership, and personal freedom.